Tradingview: How Can It Help You?
With the advancements in financial technology, the self-taught investment individual on the rise. Information is known near instant speeds and the playing field for market entry is level. Following closely, tools and data points to obtain this information became a necessity. One of the most popular ways to analyze a company or fund is through technical analysis. This requires the use of a chart and various forms of technical analysis tools. All of that being said, there is one platform that is free to use that offers a wide variety of charting tools and community assistance, that platform is TradingView.
Trading View is one of the most widely used free charting platforms on the Internet as it is both comprehensive and clean. With many free charting platforms, you have access to very few tools and the data points are poorly plotted. However, with TradingView, you can plot and produce quality charts with ease.
Do you want to try it for free? Here’s the link!
What is TradingView?
As you already know, TradingView is a charting platform. However, it is more than just a charting platform that involves a community of individuals that have an interest in various market types. With TradingView, you can publish your charts and see what others think about your analysis.
From there, should want to design or find a more custom indicator, TradingView has the tools that allow you to build your own indicator to fit the TradingView platform. The website and services that are offered for free are second to none. Of course there are paid subscriptions but we’ll get to that later.
Trading View Fact Sheet 2026
- Receive market insights and real-time information at Trading View.
- 8,794,466 investors use Trading View.
- Traders have published 4,558,151 ideas and created 23,947,564 charts on Trading View.
- Use Trading View in the browser of any device, at any time.
- Use Trading View to interact with millions of traders from different parts of the world.
- It features the best HTML5 charts with 50+ intelligent drawing tools.
- Trading View offers a stock screener with 100+ fields.
- Use 100+ pre-built studies for an in-depth analysis of the market.
- It offers support for multiple brokers.
- TradingView gets data from 50+ data feeds and exchanges.
- Download mobile TradingView apps on the Apple Store and the Google Play Store.
How Does TradingView Work?
TradingView works very smoothly from the start and the first thing you should likely do is open an account. This will allow you to utilize the charts without being timed out. The sign up process is simple and very self-explanatory.
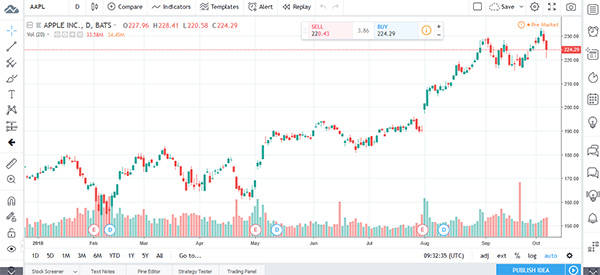
From there, you can begin seeing how the platform works. First, you will notice you can find nearly every equity or fund and open up a chart. Once you’ve opened up a chart, you can begin playing around and seeing what all it offers. The chart page offers you the ability to have a watch list, bid and ask spread, and any up to date news on the equity you are looking at.
Next you can begin finding the right tools and data plots for your trading needs. One of the benefits of this platform are the many different charting tools you can use. The basics are there, such as lines and Fib numbers, but you can add more intricate plots such as volume area profile and implied volatility.
Once you’ve found the right plots and have the chart completed, you can publish your chart for others to see. This is a beneficial feature because if you are new to technical analysis and want others input, you can engage with other like-minded individuals.
Should you want to take a slight fundamental approach, there are various chat plots such as P/E, Cash Flow, and other fundamental data that can be plotted on a chart. This is a helpful way to incorporate different facets of analysis to your research.
Switching gears, one of the other ways you can utilize TradingView is to research using individual technical indicators. For example, if you want to see charts that utilize RSI, you can search for various people who have published a chart using the RSI technical indicator. This is true for any of the technical indicators you wish to search. Also, if you want to search by equity, you can see individuals who have posted their chart analysis on that specific equity.
Other ways to use TradingView include setting chart alerts such as price levels or technical indicator triggers. You can also save your chart and publish it on your own website or other publishing platform. If there is something you think of, odds are TradingView has an option for you.
Free Versus Paid Account
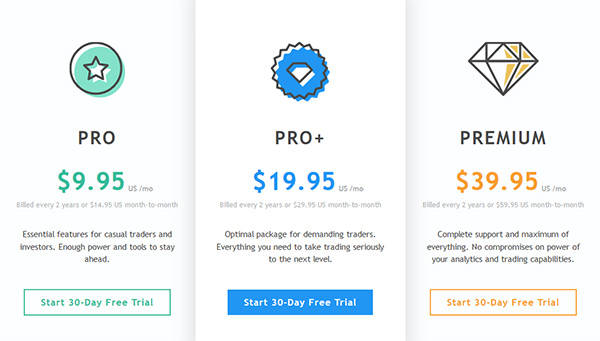
Much of the mentioned above is available on the free account status, but for those of you that are more advanced in your charting will likely find you need more. Have no worries are there are four different tiers on the TradingView platform. The tiers are free, pro, pro+, and premium.
With the free account, you have access to one chart per layout, one device at a time, and three indicators per chart. From there, you have limited indicator templates and saved chart layouts. While these are effective for the beginner, you may find that you become limited in your analysis and that’s perfectly fine as there are three additional tiers.
The next tier is Pro, which costs $9.95 to $14.95 a month, depending on how you pay. With Pro, you are allowed two charts per layout, still only one device at a time, but you can have ten server side alerts and five indicators per chart. Having limited indicators per chart can be a motivating factor to upgrade because you ma quickly find three or even five isn’t enough.
The third tier on TradingView is Pro+, which starts at $19.95 to $29.95 a month, depending on your payment method. With a Pro+ you are allotted four charts per layout, allowing for multiple time frame analysis, which is great for those who day trade. Pro+ allows for two devices to load charts at the same time and indicators per chart is increased to ten.
Lastly, should you need the most robust and accommodating platform package, there is Premium. Pricing starts at $39.95 to $59.95 a month depending on your payment plan. With Premium you can utilize eight charts per layout, 25 indicators per chart, and utilize five devices at one time. This may seem a bit excessive but for the one that is a professional trader, this will allow you to work without interruption.
Free Trading Ideas
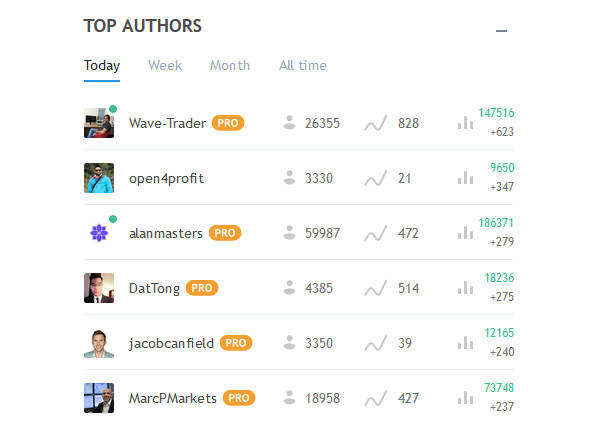
This was alluded to earlier but if you find yourself needing trading ideas, you can visit the trading idea portion of their website and see what others are doing. Anything from cryptocurrencies to the largest company stock, odds are you will find a community that is talking about what you’re interested in.
The trading ideas can be sorted however you see fit. If you want to see short-term or long-term charts, technical or fundamental, you can sort to find what you need. That being said, if you feel you can provide value to the community, you can publish your work for others to see. TradingView has done a wonderful job of providing value to their community, and you likely won’t find this quality of free content elsewhere.
One of the benefits to posting your chart on trading view is once you post it, you can’t edit the drawing or indicators. Why this benefits you the trader because you can see someone’s idea and if it actually played out as planned. This should not be used to prove if one person is better than another, but rather how you can learn and adapt for the next analysis.
Screeners
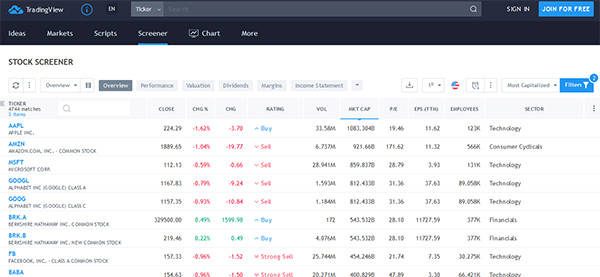
One of the first things many traders and investors do is screen for their stocks. How you screen and what you screen is certainly up to you, but having a screen available is important. You can view the screener and see for yourself, but here is a brief overview of TradingView’s stock screener.
You can sort your screeners findings how you see fit, but some of the ways you can scan for stocks include performance, valuation, dividends, and margins. Screeners allow you to find a general group of stocks that fit your profile; from there you can begin analyzing each equity and see if it fits your profile.
Also, if you find yourself trading Forex, there is a screener for that as well. You can sort by performance or oscillators, which can help predict overbought or oversold markets.
Trading View FAQs

👉 What brokers does Trading View support?
Trading View supports multiple brokers such as Oanda, DirectFX, Forex.com, Modalmais, and others. It supports only one crypto broker—Poloniex. Also, it supports certain futures traders via CQG API.
👉 Is there are Trading View app for mobile devices?
Trading View offers a native app for Android smartphones and tablets. This app puts all financial markets on your palm. You can access real-time data and your favourite charts on the go.
👉 How much does Trading View cost?
If you are a beginner, Trading View is free. In other words, you can get started at Trading View without spending any money. You can enjoy features such as charts, market data coverage, stock screens, 50+ smart drawing tools, 12 customizable types of charts, backtesting, and over 100k technical indicators. If you are looking for something more, you can go in for the Pro plan, which costs $14.95 every month; the Pro+ plan, which costs $29.95 every month; and the Premium plan, which costs $59.95 every month.
👉 Can I trade on Trading View?
If you have an account at any of the brokers that Trading View supports and link it to your Trading View account, you can buy and sell on Trading View. Or you can practice trading with fake money till you become an expert.
👉 How does TradingView work?
TradingView caters to the requirements of beginners as well as advanced traders. It offers sophisticated charting tools, which you can use to view and share trading ideas. You can use TradingView to do your market research from anywhere because of its browser-based charts and real-time data. You don't have to download and install any software to use TradingView. Just open the website on any browser to start learning, charting, and sharing your ideas.
👉 What is Pine Script?
Pine Script is Trading View's scripting language. Users of TradingView.com create custom indicators with Pine Script and run them on its servers. It is a lightweight language that is useful in creating strategies and indicators.
👉 What shows does TradingView offer?
TradingView is home to a selection of shows that give traders access to the top names in crypto space and finance. You can listen to their ideas and opinions on the latest market happenings.
How Can TradingView Help You?
TradingView is an extremely useful platform that allows you the user to essential find and craft anything you need. Should you need a simple chart, you can do that by just searching the ticker and pulling up the equity. Within the chart, you can begin populating with technical indicators or even changing the charting style. From there, you can publish your ideas for all to see or utilize the chart on your own personal website or content.
Investing has taken a learn as your go approach and that thanks to the flow of information and the growth of financial technology. For those out there looking to try their hands at technical analysis, TradingView is a very solid way to go. You can find what you need without needing to spend money. Also, if you are looking for a solid platform that can still help with your research but doesn’t cost much, you can certainly utilize Trading View. Should you need more charting abilities, they offer four different tiers. TradingView is easily one of the best free charting platforms on the market and will likely become your go to. Between the community and services, TradingView makes it difficult to say no.